


Vote counts tell you something got attention. They don’t tell you who cared, when it happened, or whether traffic turned into real reactions.
WP ULike Pro Statistics closes that gap. Open WP ULike → Statistics and you get one panel for the daily pulse and the deeper reports: who liked each post, engagement rate, geography, devices, content intelligence, advanced logs, exports, and (for shops) likes vs sales.
Free and Pro share the same Statistics home. Free answers “what happened today?” Pro answers “who cared, where they came from, and what should we do next?” Both plugins stay installed together. Your votes stay put. Pro just unlocks more of the same data.
What you get inside WP ULike Pro Statistics
First, the shared home screen. Then the Pro reports that turn counts into decisions.
- Overview. Totals for today, yesterday, this week vs last week, and all time.
- Insights. Short growth tips tied to your own numbers.
- When to publish. Peak windows through the day, with Pro heatmaps for finer timing.
- Engagement. Charts and top lists across posts, comments, BuddyPress, bbPress, and more.
- Audience intelligence. Who liked, top fans, geography, devices, and engagement rate.
- Content intelligence. What your audience keeps rewarding with votes.
- Logs and exports. Search, filter, bulk cleanup, plus CSV, PNG, and SVG exports.
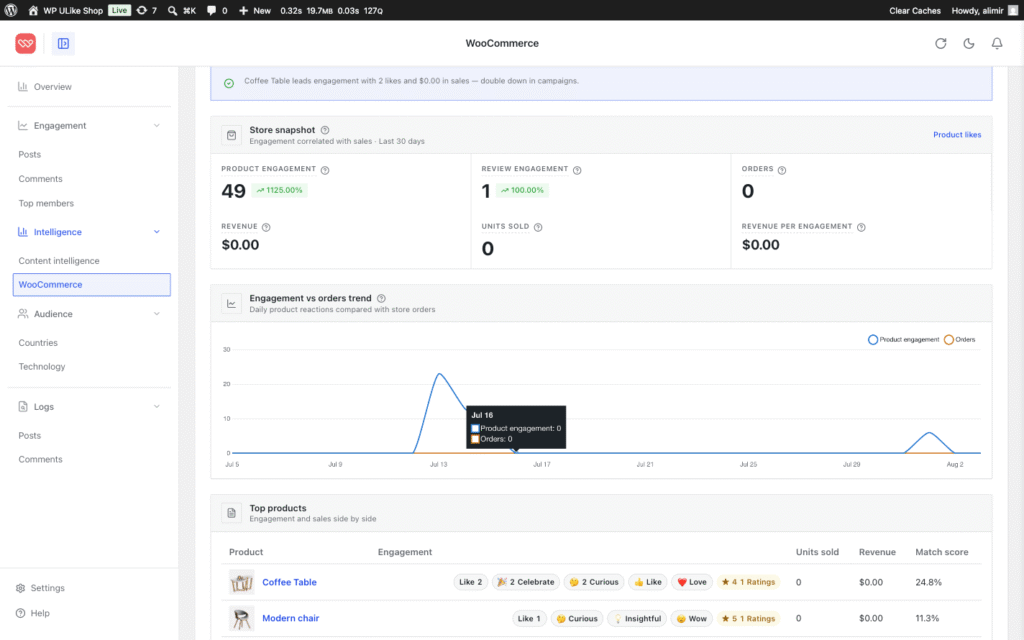
- Store reports. WooCommerce likes vs sales, shop spotlight, and product engagement.
Overview: your daily home screen
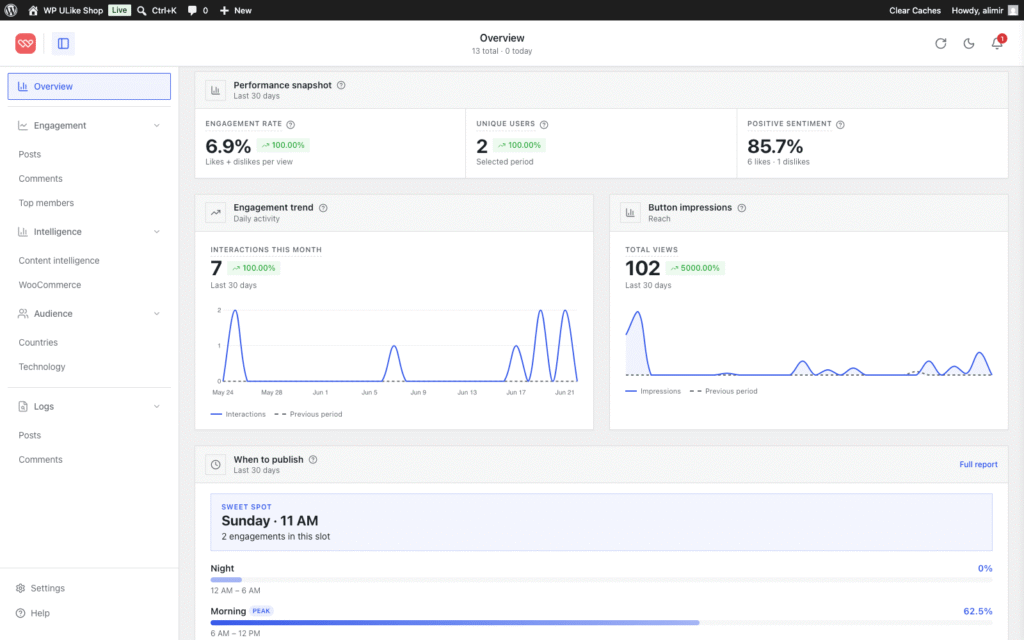
Most days start on Overview. Total engagement, today’s activity, yesterday’s count, and week-over-week sit up front. You get the pulse of the site without jumping between four reports.
Above the totals, Insights adds short tips based on your numbers. You might see a momentum shift, a milestone, or a quiet day compared to yesterday. Charts show the shape. Insights help you read it faster.
See who liked each post
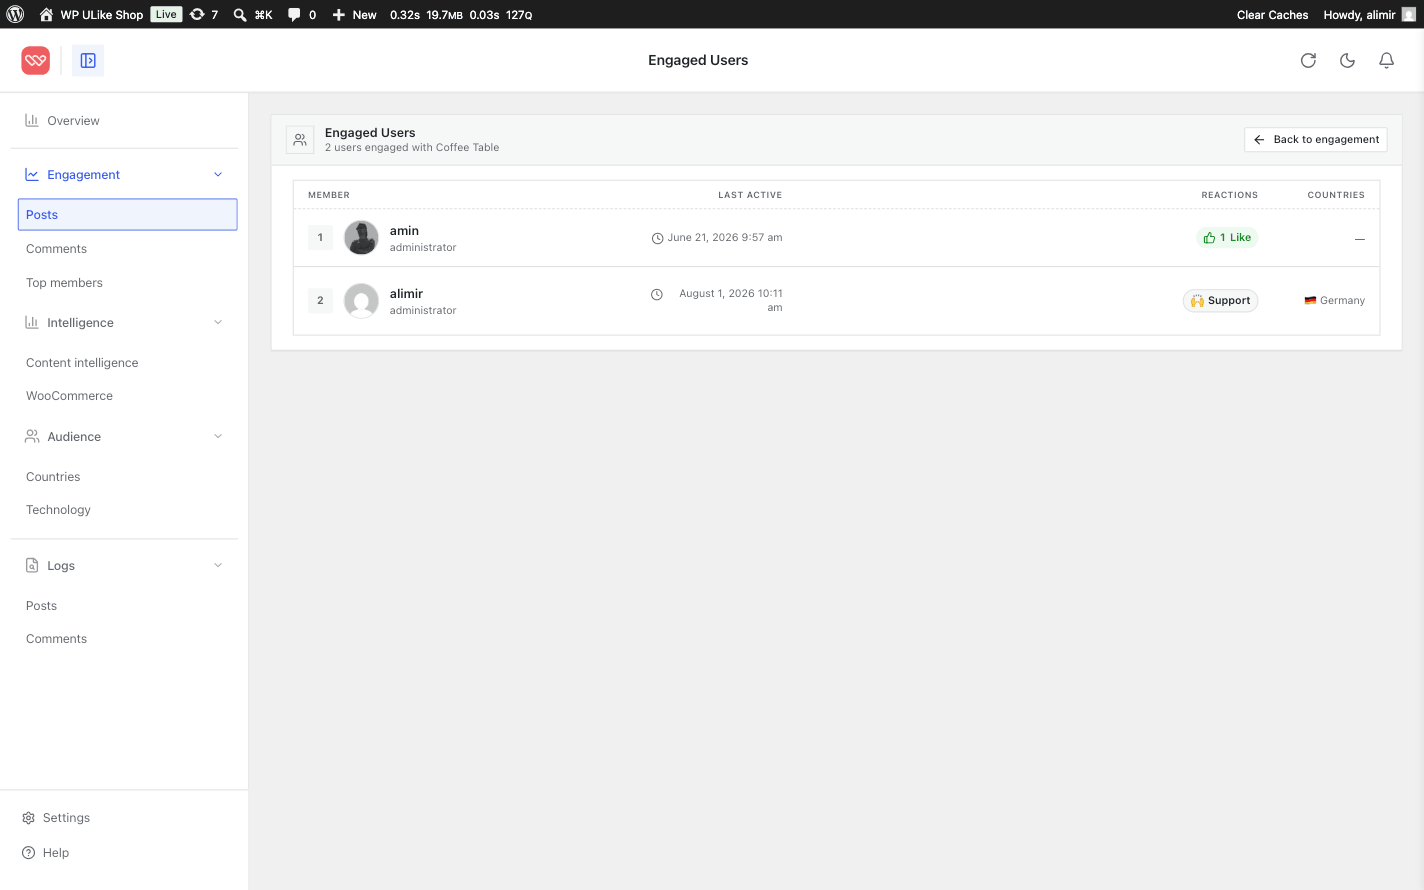
Raw counters hide the people behind the number. With WP ULike Pro Statistics, open a post (or any supported content type) and see who actually liked it.
That matters when you’re building community, spotting superfans, or checking whether engagement looks real. Your top fans sit in one list, so you can recognize the people who keep showing up across the site.
Engagement rate: reaction quality, not luck
Fifty likes on 200 button views is a hit. Fifty likes on 10,000 views is a softer signal. Pro tracks engagement rate: how many people saw the like button and chose to act.
Views count when a real visitor actually sees the button. Bot and admin noise stay out. Interactions are matched to the same period as the views, so old likes don’t inflate a new report.
In short, you stop ranking posts by traffic luck and start ranking them by reaction quality. Editors and store owners use this to decide what to feature, rewrite, or retire.
When people vote, and Pro heatmaps
Overview surfaces when people vote most: morning, afternoon, evening, or night. That alone helps you schedule posts, newsletters, and product drops.
Pro adds heatmaps when you need finer timing detail. You’re not guessing from session charts alone. You’re looking at when people hit like.
Geography and devices
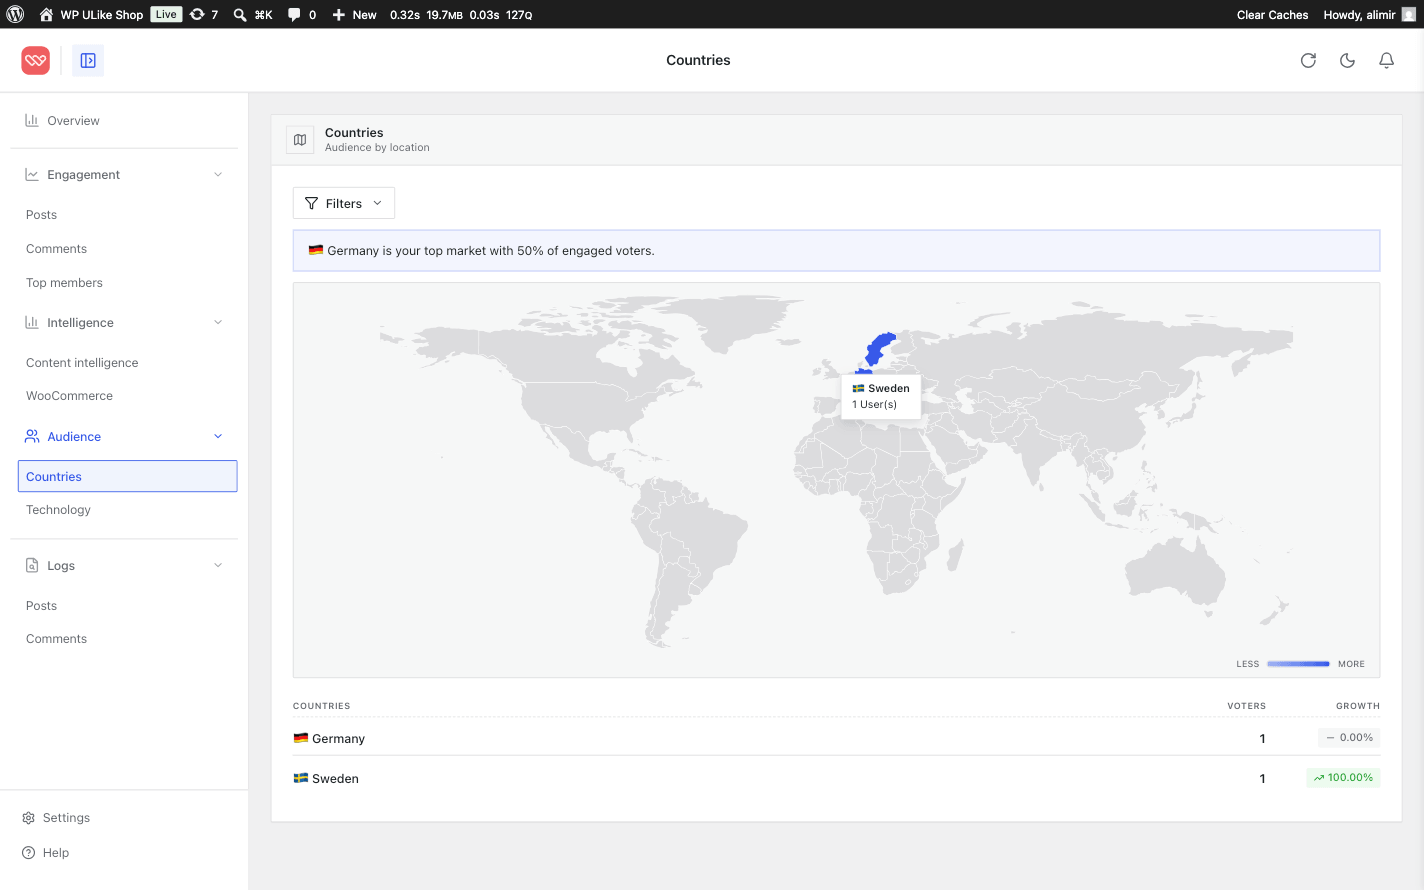
Also inside Pro Statistics: a world map of top countries, plus a clear split of phones vs desktops.
Use geography when a campaign or language lands harder in one region. Use devices when a high-traffic page underperforms on mobile layout or button placement. Same panel. More audience context next to your charts.
Content intelligence: what to write next
Charts show the past. Content intelligence helps you plan the next piece.
Pro ranks what your audience keeps coming back to. You spot themes that travel, formats that win, and topics that quietly underperform. Less “I think this did well.” More “here’s what people keep rewarding with votes.”
Engagement charts, top content, and top users
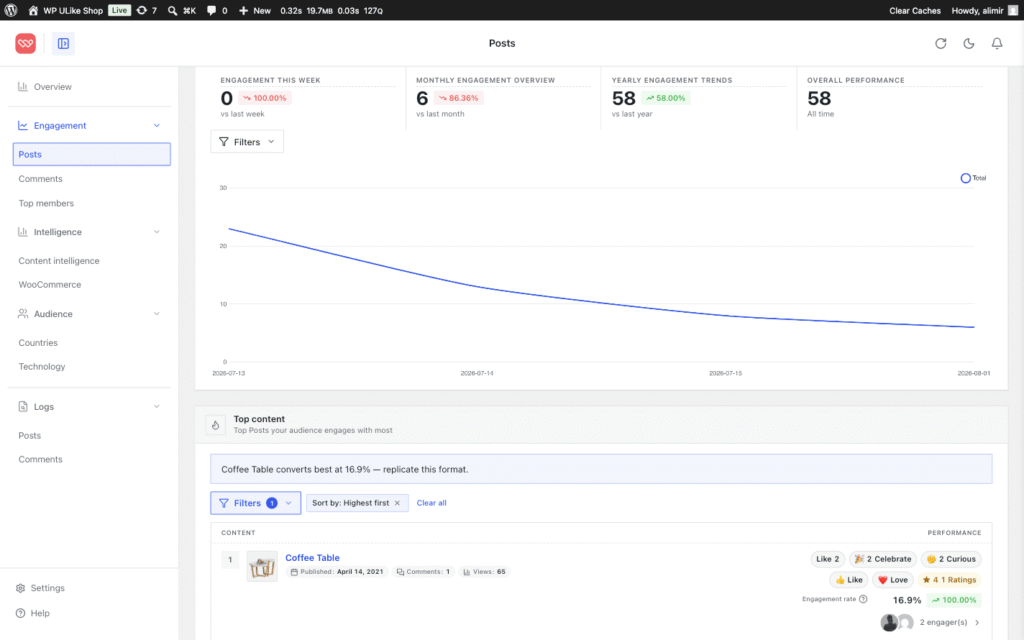
When you want trends and ranked lists, open Engagement. Posts, comments, BuddyPress activity, bbPress topics, and more. Types with no votes stay hidden, so you’re not clicking empty tabs.
Filter by date range and reaction status. Compare this week, this month, or the longer view. Top content and top users stay easy to scan, with pagination when the site is large.
Next, use those lists for editorial roundups, community shout-outs, or a quick audit before a campaign. You can also show top lists on the front end with Pro widgets and shortcodes. The Statistics panel stays the source of truth behind those displays.
Advanced logs: search, filter, clean up
Need the row-by-row story? Logs sits in the same Statistics panel. Free lets you browse by content type. Pro adds the tools you need when the dataset gets big or suspicious:
- Search and filters. Find specific voters, posts, or time windows fast.
- Bulk cleanup. Remove bad or spam votes without hunting one row at a time.
- Closer history views. Dig into user activity when a simple browse isn’t enough.
If you’re protecting contest integrity, auditing odd spikes, or keeping logs tidy for privacy requests, this is often the Pro layer teams feel first.
Export reports your team can share
When an editor, client, or agency partner asks what worked last quarter, screenshots of widgets don’t cut it. Pro lets you export reports as CSV, PNG, or SVG. Drop real charts and tables into a deck or email without rebuilding them by hand.
WooCommerce: likes vs sales
If you run a shop, this is often why teams upgrade.
WooCommerce tells you what sold. Analytics tells you what got views. Most like plugins stop at a heart on the product page. WP ULike Pro Statistics answers the harder question: which products do people love but not buy?
Likes vs sales puts product reactions next to orders. Spot items that get attention but don’t convert, then fix price, photos, copy, or shipping before you lose another buyer. Shop spotlight and product engagement reports help you decide what to feature, bundle, or promote.
Store reports are Pro only. Free still puts like buttons on products and shows vote data in Overview and Engagement. Store intelligence sits on top when you’re ready.
Dark mode, focus mode, and a panel that fits WordPress
Finally, the panel is built for people who live in stats:
- Dark mode for late reviews.
- Focus mode to hide the usual WordPress chrome while you read numbers.
- Dashboard settings for announcements and sidebar options.
- Admin color scheme support so Statistics follows your WordPress profile colors.
Everything loads inside WordPress only. Smart caching keeps it fast as you grow. Your visitors never download this code.
Free vs Pro in Statistics
Free includes Overview, Insights, when-to-publish windows, engagement charts, top content by type, vote logs, dark mode, and focus mode.
Pro adds who liked each post, top fans, engagement rate, heatmaps, geography, devices, content intelligence, advanced logs, CSV/PNG/SVG exports, and WooCommerce likes vs sales.
For the full product split beyond Statistics, see the feature comparison.
How to open WP ULike Pro Statistics
- Keep the free WP ULike plugin installed and active.
- Install and activate WP ULike Pro with a valid license.
- Go to WP ULike → Statistics.
- Start on Overview, then open Engagement, Logs, and the Pro reports you need.
Your front-end buttons don’t change. Your existing votes don’t reset. You’re adding depth to the same engagement data.
Try one report this week
Pick one Pro report and act on it:
- Open your top post and scan who liked it.
- Sort by engagement rate and find a high-traffic, low-reaction page to improve.
- Check the heatmap before you schedule next week’s posts.
- If you sell online, open likes vs sales and pick one product to fix.
Stuck on something, or wish Statistics answered a question it doesn’t yet? Tell us. We read every note.
Get WP ULike Pro · Download free WP ULike · Documentation
Frequently asked questions
Do I need both free and Pro for Statistics?
Yes. Pro works alongside the free plugin from WordPress.org. Install and activate both. Your votes and settings carry over when you add Pro.
What does free Statistics include?
Overview totals, Insights tips, when-to-publish windows, engagement charts, top content by type, vote logs, dark mode, and focus mode.
What does WP ULike Pro Statistics add?
Who liked each post, top fans, engagement rate, heatmaps, geography, devices, content intelligence, advanced logs, CSV/PNG/SVG exports, and WooCommerce likes vs sales.
Can I export reports?
Yes. Pro supports CSV, PNG, and SVG exports so you can share charts and tables with your team or clients.
Does Pro include WooCommerce likes vs sales?
Yes. Store intelligence is Pro only. Free still supports like buttons on products and shows vote data in Overview and Engagement.
Will Statistics slow down my site?
No. Like buttons on the front end stay lightweight. Statistics runs inside WordPress only and uses smart caching. If you use a full-page cache plugin, purge once after updating.
Where do I open WP ULike Pro Statistics?
Go to WP ULike → Statistics. Overview is the home screen. Use the sidebar for Engagement, Logs, and Pro reports.



Leave a Reply